What to Put in a Monthly Client Report, and What to Leave Out
A client report should take ten minutes to read and answer one question: was this worth it? Here is what belongs in, and what to cut.
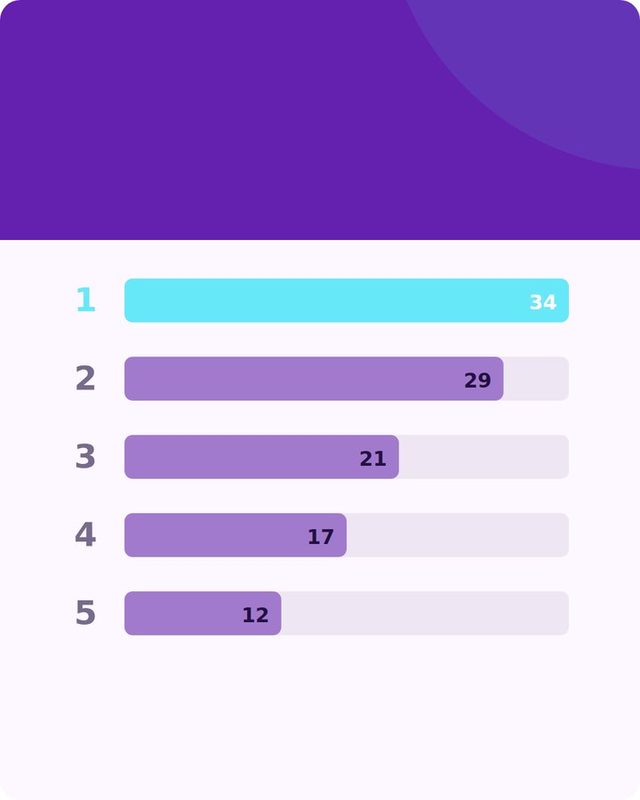
A good monthly report answers one question in the first thirty seconds: is this working. Everything else in the report either supports that answer or gets in its way.
Start with the question the client actually has
Clients rarely care how many posts went out. They care whether the money they spend on social is doing something for the business. Before you open a spreadsheet, write down the one or two goals you agreed at the start of the engagement: more calls, more foot traffic, more sign-ups, more awareness in a specific city or niche. The report exists to answer whether you moved those numbers, not to prove you were busy.
If you never agreed on a goal, that is worth fixing before your next report, not during it. A report with no goal attached just becomes a list of activity, and activity alone does not keep a client renewing.
What to include
- A one-line summary at the top. One sentence: what happened, in plain words. "Engagement grew, website clicks from social were flat, we are testing two new caption styles next month." The client should be able to stop reading after this line and still know where things stand.
- Three to five numbers, not thirty. Pick the metrics tied to the agreed goal: reach, engagement rate, link clicks, follower growth, or leads if you can track them. Showing every metric the platform offers makes the report look thorough and feel useless.
- What worked and what didn't. Name the specific post or format that did best and the one that did worst, with a short reason if you have one. This is more useful to a client than a chart, because it's a decision they can act on. If you're tracking this across networks already, a simple worked or didn't table does the job well, similar to what's described in what worked where.
- What you're changing next month. One or two adjustments based on the data: posting more of a format, dropping one that flopped, testing a new hook style. This turns the report from a scoreboard into a plan.
- A short list of what was posted. Not every single post, but a sample, three to five examples with a thumbnail or link, so the client can see the work without scrolling their own feed.
- Anything that needs their input. A photo you're waiting on, a question about tone, an approval that's been sitting. Put it in writing so it doesn't get lost in a call.
 Want this written for your brand?
Fullmedia Alchemist drafts posts from your own website and brand facts, so nothing is made up. Start free, no card.
What to leave out
- Vanity totals with no context. "10,000 impressions" means nothing without a comparison to last month or to the goal. A number alone invites the question "is that good?" and you don't want the client asking that mid-report.
- Every metric a platform's dashboard offers. Reach, impressions, saves, shares, profile visits, story taps, video completion rate: pick the three that matter for this client's goal and drop the rest. More numbers do not mean more insight, they mean more scrolling.
- Jargon the client didn't ask to learn. Terms like "dwell time" or "share of voice" make a report feel like a test. Say what happened in the words you'd use on a phone call.
- Apologies disguised as data. If a month was slow, say so in one line and explain the plan. Don't bury a weak month under five charts hoping it won't be noticed. Clients notice, and they respect directness more than padding.
- Screenshots of every single post. It bloats the document and buries the two or three posts that actually matter. A sample is enough; the rest can live in a shared folder if they want to browse.
- Industry benchmarks you can't back up. Unless you have a reliable, current source for "average engagement rate in your industry," don't guess at one. A made-up benchmark is worse than no benchmark, because it sets an expectation you can't explain later.
A simple structure to copy
- One-line summary at the top.
- Three to five goal-linked metrics, each with last month's number next to it for comparison.
- Best post and worst post, with a one-line reason for each.
- Two or three sample posts, shown or linked.
- What you're changing next month, in one or two bullets.
- Anything you need from the client, listed clearly.
Keep the whole thing to one page if you can manage it, two at most. A report that needs a table of contents has stopped being a report and become a document the client has to schedule time to read.
Where the raw material comes from
A report is only as good as the notes you kept during the month. If you're tracking link clicks per post, tagged links make the "what worked" section much easier to write with actual numbers instead of guesses, as covered in tagged links in Content and Reach. And if you're running a consistent weekly process already, pulling the report together is mostly a matter of summarizing what you logged, which is easier when your routine is tight, like the one in a 20-minute weekly social media routine.
Where Fullmedia Alchemist fits
If you're using Content to run the brand's posts, the "What worked where" table shows which networks and formats did best from the results you saved, so you can pull that straight into the report instead of rebuilding it from scratch each month.
The real test of a good report
A client should be able to read your report and, within a minute, answer three things: did it work, what's changing, and do they need to do anything. If any of those three isn't obvious, trim something else out rather than adding more to explain it. The report's job is to save the client time, not to prove you spent yours.
Turn your brand into a week of posts.
The Free plan includes 30 credits a month. No card.